
Pricing Estimate Accuracy Tool
Improved accuracy of machine-generated insurance cost estimates through manual curation using this D3- and crossfilter-based visualization tool.
As part of our commitment to pricing transparency, Counsyl prepares an individual price estimate for each patient based on their unique insurance benefits.
To ensure that these estimates are accurate, we built a manual review tool that lets us investigate and examine claims where our estimate of expected patient cost does not end up being accurate.
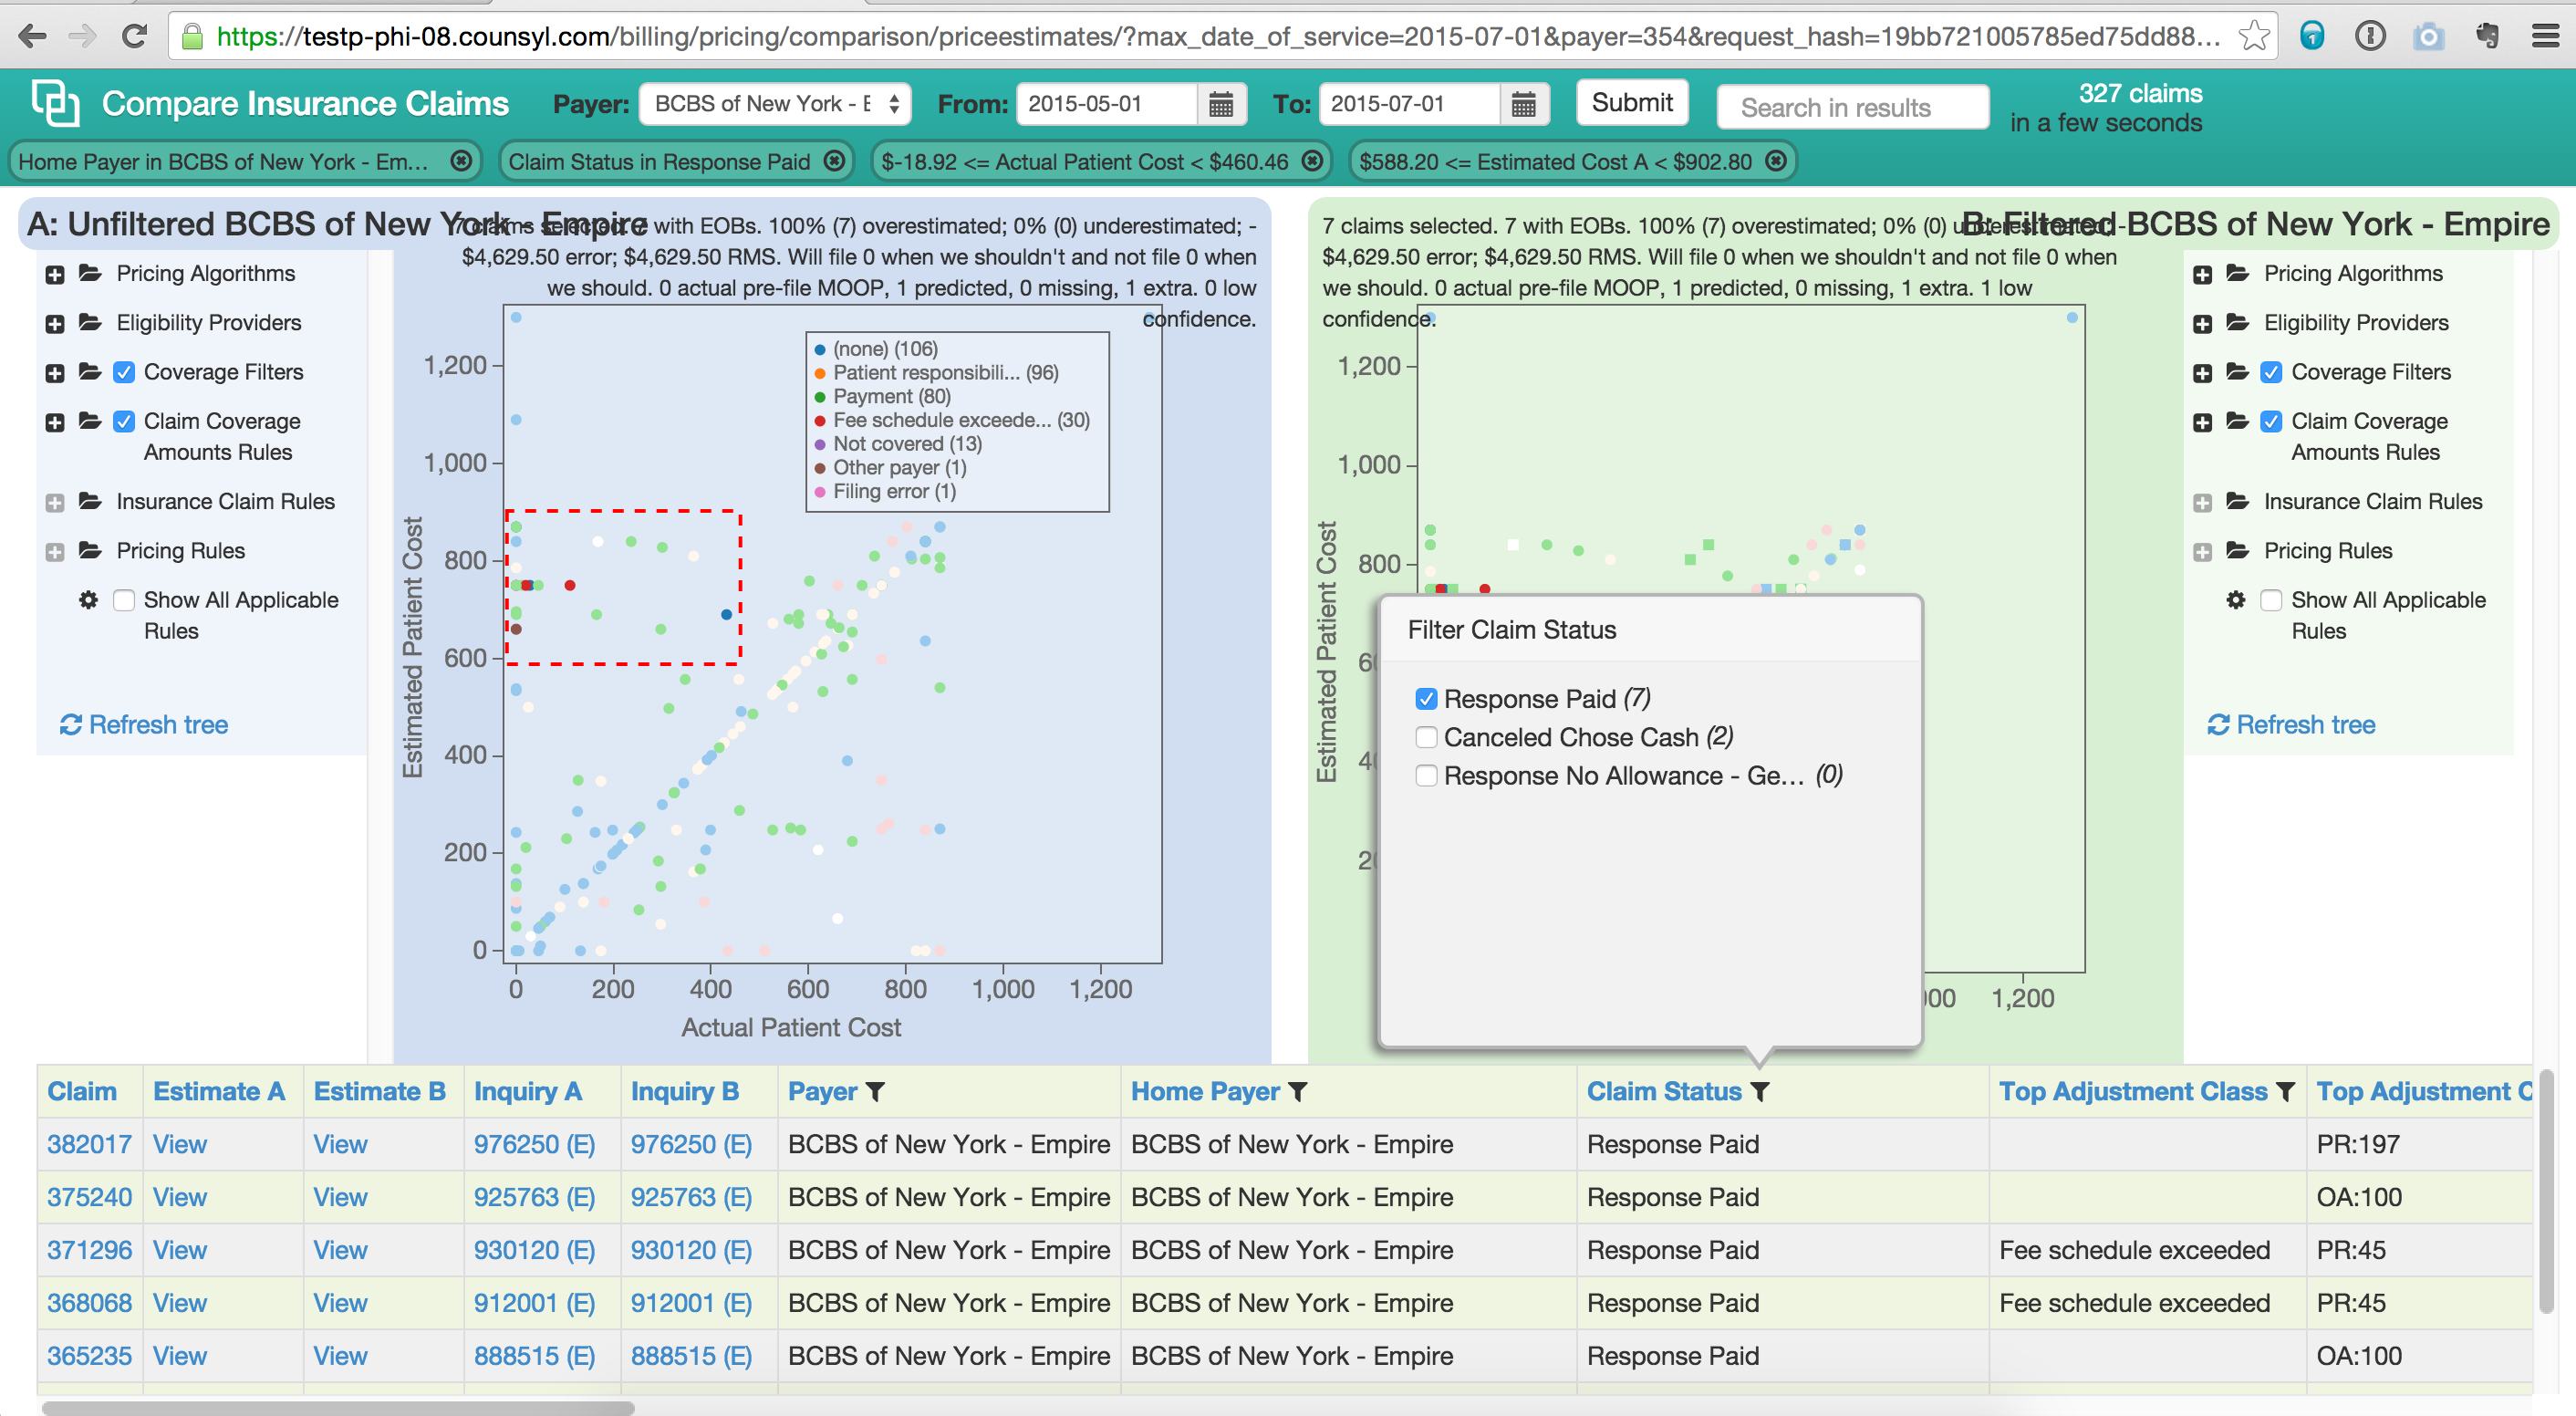
The tool works in a retrospective, A/B-comparison fashion using claims that have already been filed and adjudicated. The tool exposes configurations of the underlying estimation engine (described in more detail in a talk. These configurations, represented as trees on the left and right of the screen above, can be changed in real time, and the tool regenerates estimates on-the-fly. The tool then plots actual vs estimate cost and lets you dig into specific cohorts of claims that have incorrect estimates.
Our engineers and billing managers used the tool for manual curation of filters that select out the correct benefits data from eligibility responses, and also for various tweaks to the estimation algorithm. Using the filters at the top you can very quickly dive in to subsets of claims that demonstrate differing anomalous behaviors, isolate those to correct them and then double check the impact your modifications have on the entire dataset.
The tool also allowed billing executives to speculate about different pricing regimes. We can submit sets of claims with differing Common Procedure Terminology (CPT) or billing modifier codes, and then compare how insurance companies respond to that coding vs historical expected allowed and denied amounts. This also helps us target specific underperforming claims for automated appeal or manual follow up by billing agents.
We were able to achieve > 85% accuracy for claims, with most of the remaining error resulting from erratic and unpredictable behavior of insurers, which we solved using automated and manual follow up processes.
Technically, this tool was implemented using coffeescript and crossfilter with D3-based visualization.
Lessons learned:
- The value of looking at lots and lots of data.
- Importance of speculative tools in algorithm development.
- Value of real-time feedback: the faster we were able to make the tool, the more examples our users could examine and the better our estimates got.