
Introduction to Mass Spec Proteomics
In this talk, I introduced the field of proteomics to an audience of biostatisticians, with a particular emphasis on mass spectrometry and 18O labeling techniques.
(An invited presentation at International Biometric Society, Eastern North American Region, 2007.)
By analogy to the genome, the study of proteomics attempts to analyze the entire set of proteins expressed in humans or other organisms. Because proteins are the biological molecules most directly responsible for function, being able to identify and quantify proteins from an organism can be very valuable to diagnose and even predict disease. One desirable goal would be to find and validate novel biomarkers, biological molecules where a change in concentration may presage disease.
Blood is a particularly attractive and yet fiercely difficult biological matrix to explore for biomarkers: while it is readily available, blood contains millions of different proteins:
| Kind | Source | Proteins |
|---|---|---|
| “True” Plasma Genes | ~500 genes x 20 glycosylated forms x 5 different “sizes” | 50,000 |
| Tissue leakage | ~35,000 genes x 10 variants (splicing, PTMs, cleavage, etc.) | 350,000 |
| Immunoglobulins: | 10,000,000 |
spanning over 10 orders of magnitude of concentration:
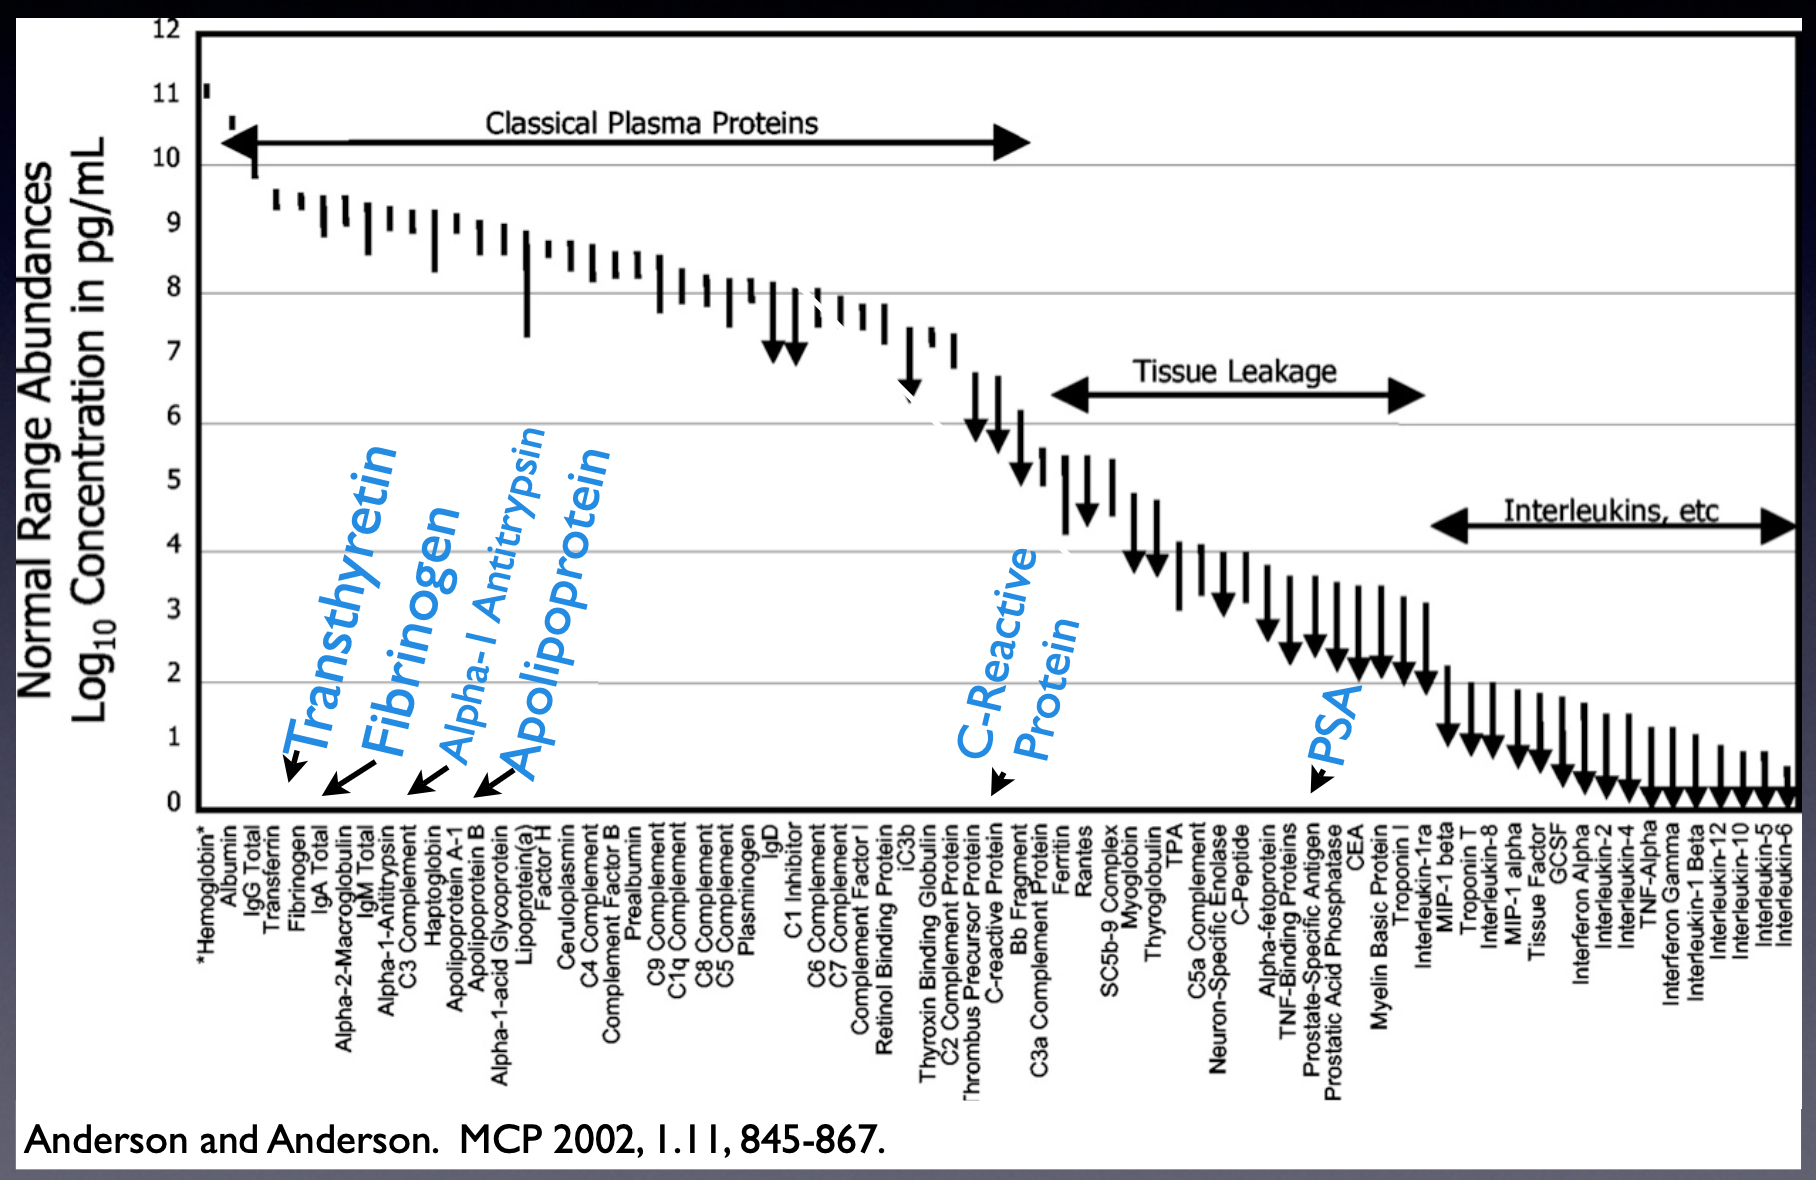
With DNA, it is possible to use Polymerase Chain Reaction (PCR) to make many copies of genes, increasing their detectability. This copying is not possible with proteins: they must be detected at the original concentration. While modern instruments are exquisitely sensitive, they have fairly limited depth or “dynamic range” to which they can detect: interesting molecules at lower concentrations, like signaling molecules or proteins sloughed off from cancer cells, are completely overwhelmed and rendered undetectable by less interesting molecules at higher concentrations.
In order to cope with this limited dynamic range, there are basically 3 strategies that one can use to detect and measure the amount of many proteins simultaneously in a complex mixture like blood:
- Throw some away: filter them by weight, extract only those that have some chemical property,
- Break them apart: make more complex molecules chemically simpler by splitting them,
- Spread them out: in space, in time, or in frequency.
In blood, throwing proteins away isn’t terribly effective because even the top 6 proteins in concentration only get you a couple of orders down in dynamic range.
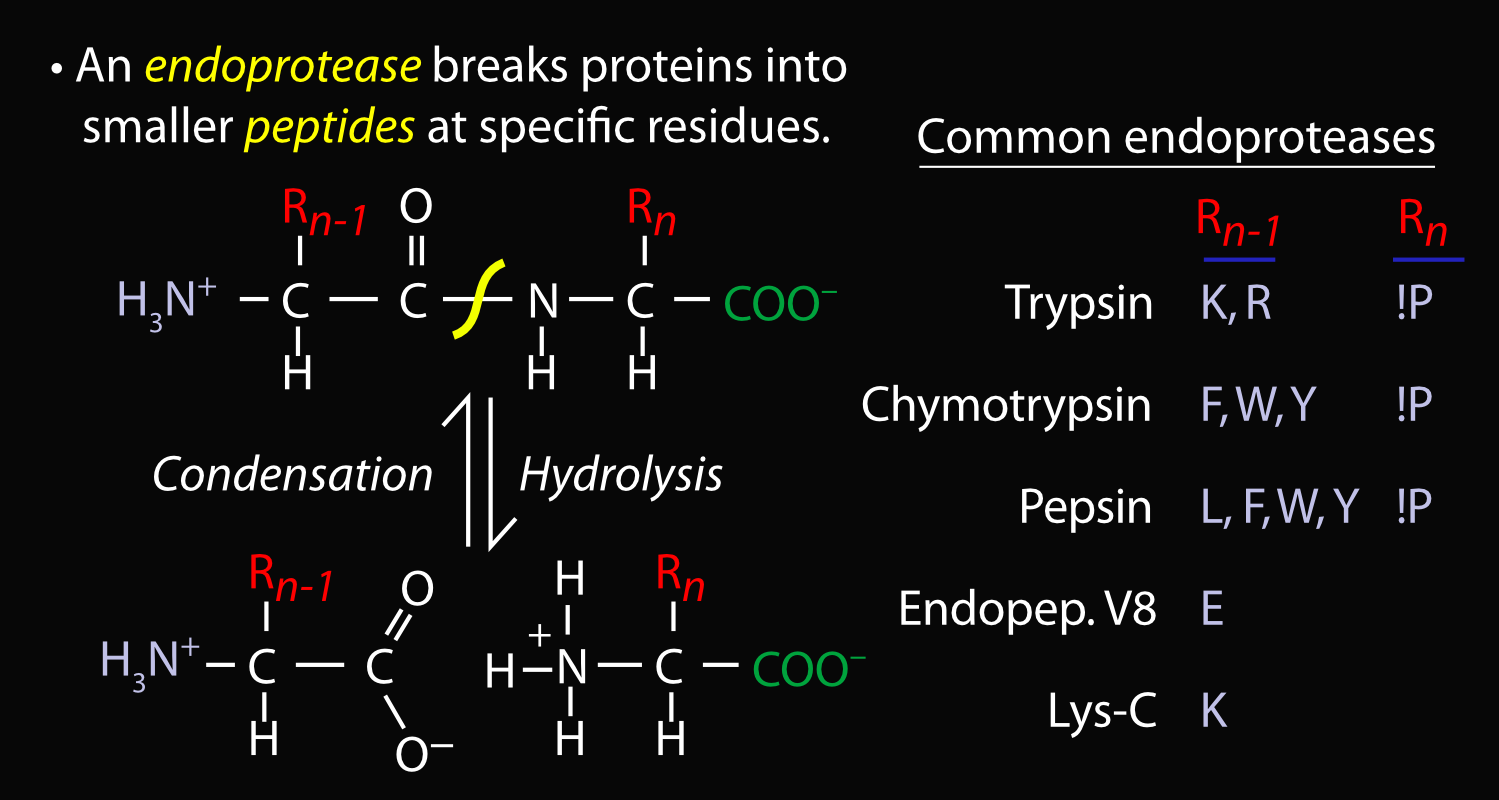
Whole proteins are very complex, having regions that have very different chemical properties; because of this they can be very difficult to analyze. Since proteins are made up of long strings (polymers) of individual units called amino acids, it’s possible to break them up into smaller pieces called “peptides” that are less massive and more uniform. The enzyme “trypsin” is one among many that can do this:
Spreading molecules out via their properties is a very effective technique. Mass spectrometers are analytical instruments that detect molecules by spreading them out based on their mass. Time-of-flight mass spectrometers, for instance, accelerate charged molecules (called “ions”) using a constant electric field and then measure how long it takes for them to travel to a detector. Based on Newton’s second law, F=ma, the greater the mass of the molecule, the longer it will take them to reach to the detector; more highly charged molecules will be accelerated more quickly.

Other kinds of mass spectrometers use different detection techniques. Ultimately, a mass spectrometer records a “spectrum” graph with the mass / charge (“m/z”) ratio of the molecules in the sample on the X axis, and a relative abundance or amount on the Y.
Because Mass Spectrometers are only semi-quantitative, it is often more accurate to compare the amounts of two different molecules in a single spectrum. 18O labeling is one technique to do perform such relative quantitation. Trypsin, by its mechanism of action, incorporates two oxygen molecules from the surrounding water when breaking up the protein. By using water where the oxygen is 18O, a non-radioactive isotope with 10 neutrons instead of the usual 8, one of the samples can be made slightly but noticeably heavier. Then they can be combined in a single spectrum and detected simultaneously (below right), and the ratio between the two samples calculated using software. For more detail on this technique, see this paper. (Amusingly, we originally performed this experiment in very pure and very expensive 18O water; it turns out to actually be better to have some slight impurities, as I explain in the paper.)

Many other proteomics techniques involve spreading molecules out, like 2D gels (spreads out molecules by two chemical properties on a flat surface) and chromatography. In chromatography, molecules are flowed through a tube lined with “sticky” coatings of various types such that the molecules temporarily adhere to the walls. Over time, the chemical composition of the liquid flowing through tube is gradually changed. By doing this, the molecules are selectively released from the walls and re-dissolve in the liquid, and can then be detected by other techniques (such as mass spectrometry). In this way, the molecules are separated by how “sticky” they are.
In reality, because of the overwhelming complexity of biological samples, multiple techniques must be combined in a single experimental design. One experiment we commonly performed on blood plasma combined throwing away very concentrated proteins, breaking apart the proteins with trypsin and labeling one sample with 18O, and then two rounds of chromatography before detecting the resulting peptides with mass spectrometry.
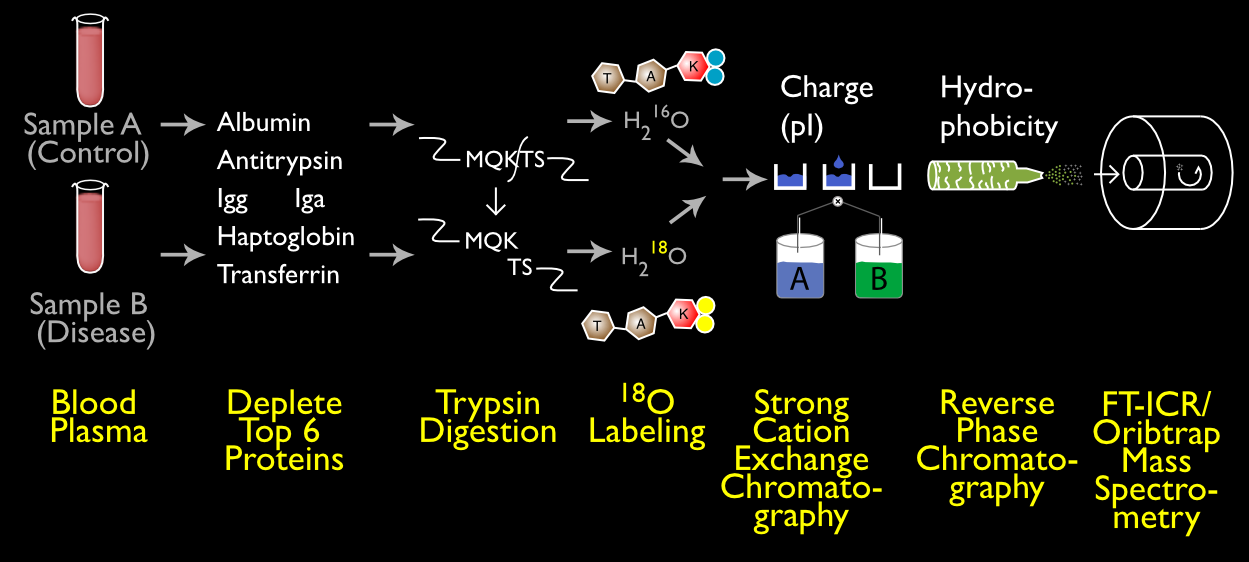
It was a complex experiment but rewarded us with the greatest depth we had yet seen.
For more details, please see the talk below or my publications.